TyG-BMI
Triglyceride-Glucose index multiplied by BMI is one of the best models to predict NAFLD.
The TyG calculation has two different formulas. This calculation uses the TyG formula with a cut-off of around 4.
Enter values
Value
Unit
Weight
Height
Triglycerides
Glucose
TyG-BMI ranges for
Steatosis (USG) was associated with TyG-BMI above 102 in males:
102
Steatosis (CAP ≥ 268.5 dB/m) was associated with TyG-BMI above 118.2:
118.2
Steatosis (CAP ≥ 238 dB/m) was associated with TyG-BMI above 115:
115
Steatosis (CAP ≥ 248 dB/m) was associated with TyG-BMI above 119:
119
Steatosis (CAP ≥ 288 dB/m) was associated with TyG-BMI above 140:
140
Significant fibrosis (biopsy) was associated with TyG-BMI above 126:
126
Risk Scale
Optimal range for TyG-BMI appears to be below 110:
70
110
120
190
- green - NAFLD unlikely
- yellow - NAFLD possible
- red - NAFLD likely
Why this optimal range?
After harmonizing all studies to use the same TyG formula and adjusting for the CAP thresholds, the findings align well across different cohorts.
The proposed optimal TyG-BMI range is based on a CAP threshold of ≥ 248 dB/m, which corresponds to S1 steatosis (≥ 5 % hepatocyte fat).
Triglyceride-Glucose index multiplied by BMI is one of the best models to predict NAFLD.
Images:
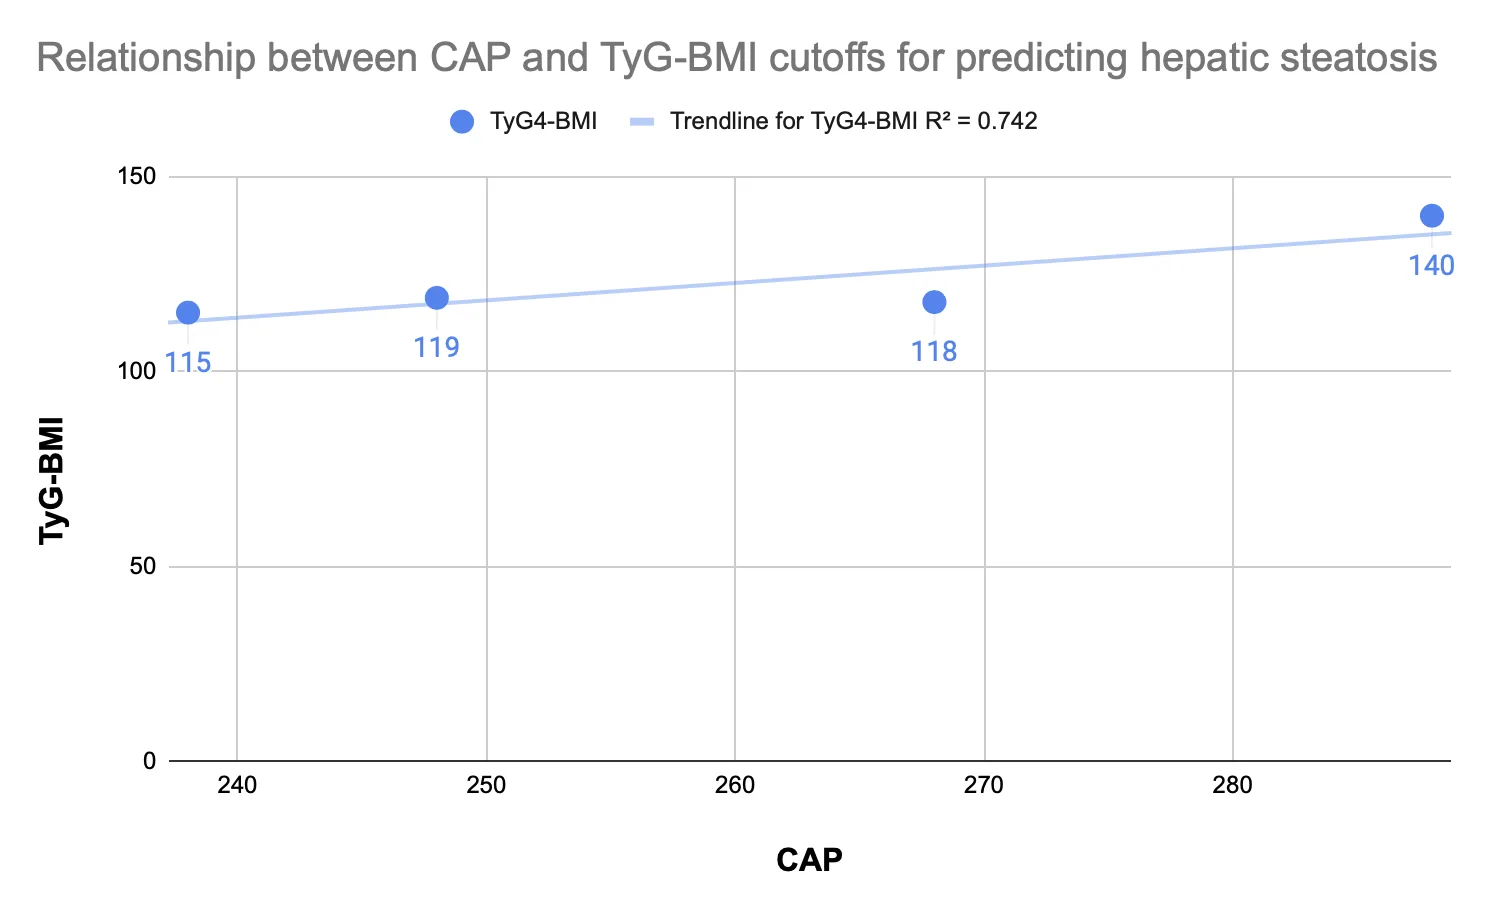
Strong relationship between TyG-BMI and CAP for predicting steatosis
Some studies calculated TyG-BMI using an incorrect TyG formula, so I’ve recalculated TyG with the correct formula and then updated the TyG-BMI threshold accordingly.

About the site author
My personal mission is to extend human lifespan by collectively adding 1 million years to people's lives.
That’s why I made this site 100% free, no sign-up, no email. Just instant results.
Zsolt SzaboPrecision Health Consultant for Longevity Clinics, Biohacker, and Software Engineer
How would you improve this tool ?
Any feedback is welcome at .