RDW
RDW reflects variation in red blood cell size and helps interpret anemia patterns with hemoglobin, MCV, and other CBC indices. It is supportive rather than standalone.
Also known as:
Red blood cell distribution width
.RDW ranges
Interpret your result
"Normal" lab range for RDW is between 11.5 and 14.5 %:
11.5
14.5
Optimal range
Optimal range for RDW appears to be between 11 and 12.6 %:
9
11
12.6
14.5
18
Why this optimal range?
Preliminary range is based on functional health organizations including but not limited to those listed above.
What a low value may mean:
What a high value may mean:
Common reasons for high RDW:
- ,
High RDW is commonly seen with iron, folate, or vitamin B12 insufficiency, mixed anemia patterns, inflammation, and recovery phases after blood loss or treatment.
Higher RDW has also been associated with worse cardiometabolic and mortality outcomes in cohort studies, so it should be interpreted with hemoglobin, MCV, ferritin, B12, and inflammatory markers.
Images:
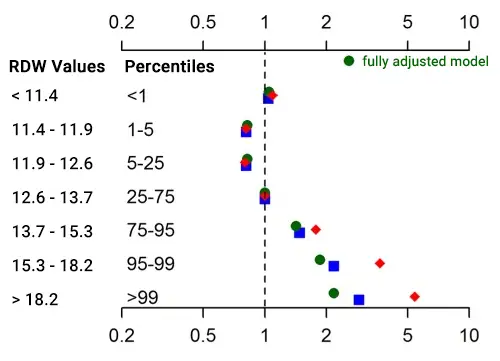
High RDW was associated to substantial rise in all-cause mortality.
Red: adjusted for demographics; Blue: adjusted for demographics and all 30 baseline morbidities. Green: fully adjusted (demographics, morbidities, and baseline HGB, WBC, and eGFR.)
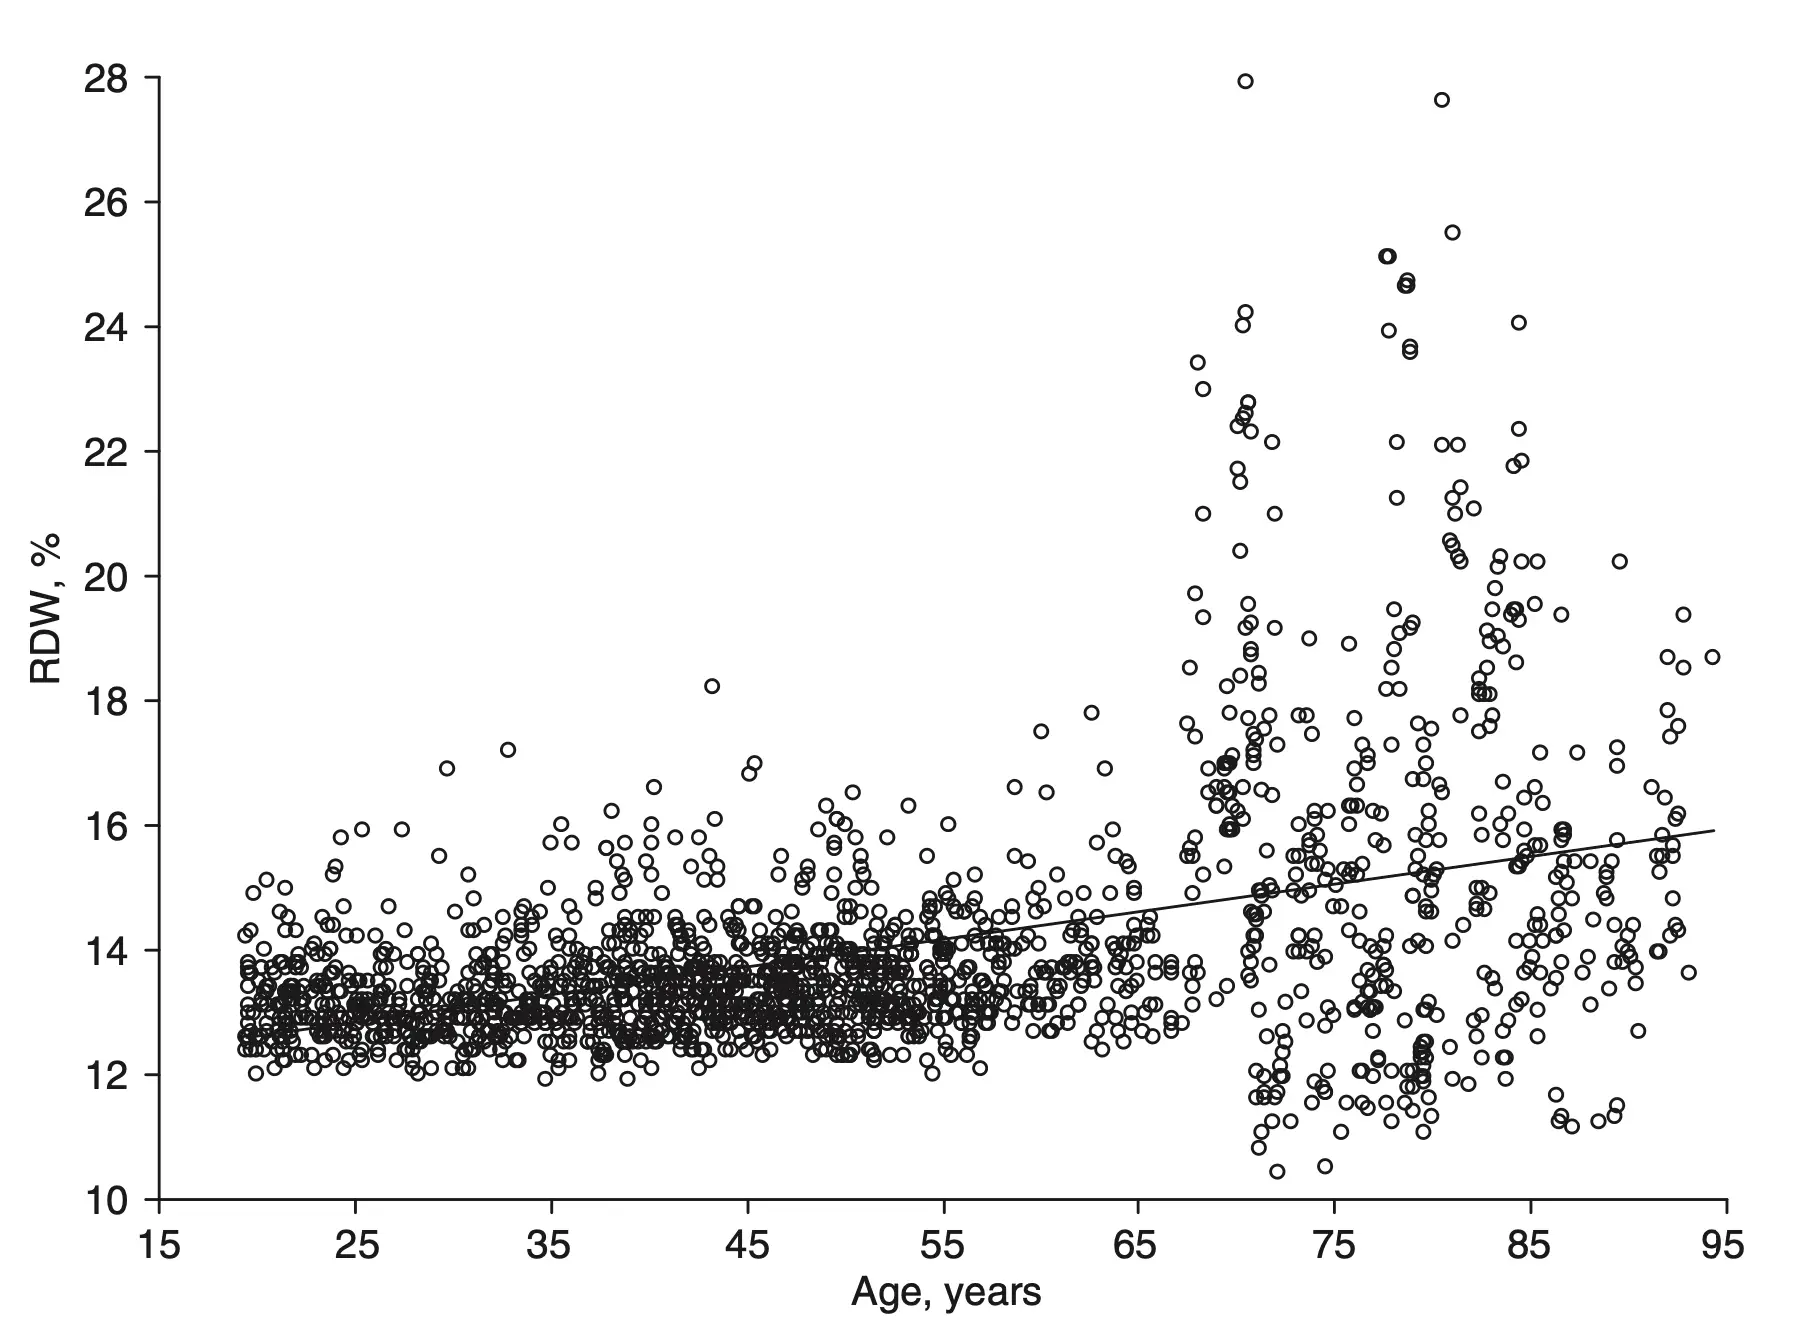
RDW increases with age
707 participants
Blood donors
Additional research is welcome for this page.
If you have relevant studies or data, please send them to the email at the bottom of this page.

About the site author
My personal mission is to extend human lifespan by collectively adding 1 million years to people's lives.
That’s why I made this site 100% free, no sign-up, no email. Just instant results.
Zsolt SzaboPrecision Health Consultant for Longevity Clinics, Biohacker, and Software Engineer
Please send me relevant research and feedback.
Any feedback is welcome at .
I am particularly interested in research on biomarkers associated with all-cause mortality and on defining optimal reference ranges.